Description
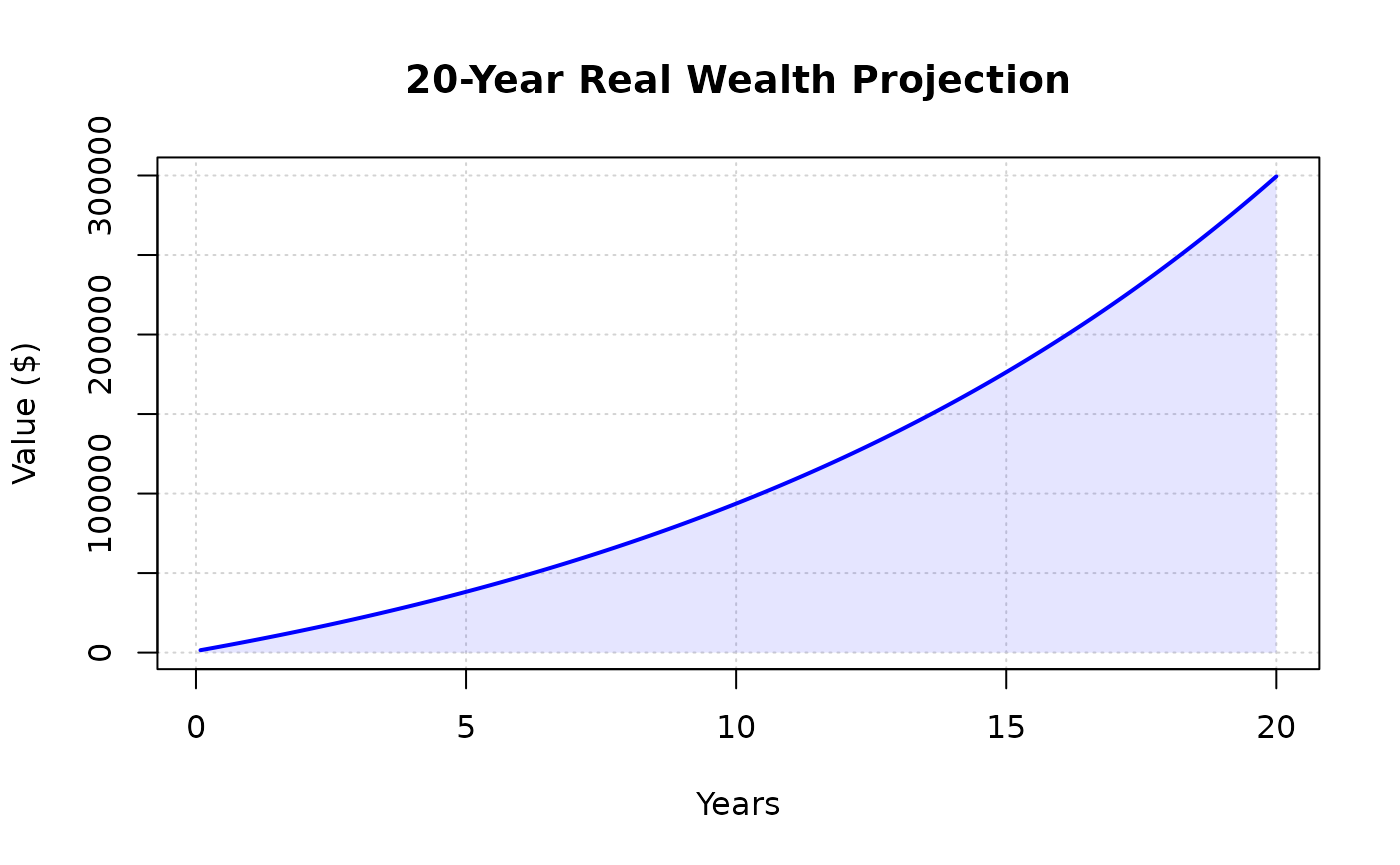
Generates a visual representation of wealth growth over time. It creates a blue line plot with a light blue shaded area underneath to clearly illustrate the accumulation of assets.
Arguments
-
data: Numeric vector. The values to be plotted, assumed to be at monthly intervals. -
title: String. The title displayed at the top of the plot. Defaults to"Wealth Projection".
Example
my_saving <- calc_wealth(1000, 500, 0.08, 20)
# Visualize the inflation-adjusted wealth
plot_wealth(my_saving, title = "20-Year Real Wealth Projection")